Log Ingestion
Log ingestion provides a way to transform unstructured log data into structured data and ingest into SmartObserve. Structured log data allows for improved queries and filtering based on the data format when searching logs for an event.
Get started with log ingestion
SmartObserve Log Ingestion consists of three components—Data Prepper, SmartObserve, and SmartObserve Dashboards. The Data Prepper repository contains several sample applications that you can use to get started.
Basic flow of data
-
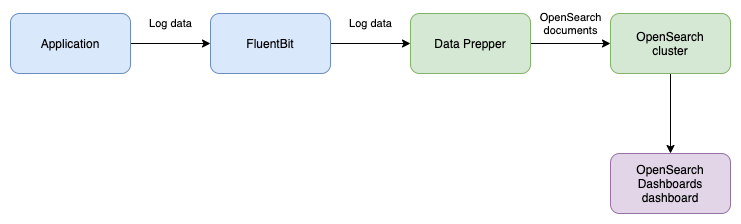
Log Ingestion relies on you adding log collection to your application’s environment to gather and send log data.
(In the example below, FluentBit is used as a log collector that collects log data from a file and sends the log data to Data Prepper).
-
Data Prepper receives the log data, transforms the data into a structure format, and indexes it on an SmartObserve cluster.
-
The data can then be explored through SmartObserve search queries or the Discover page in SmartObserve Dashboards.
Example
This example mimics the writing of log entries to a log file that are then processed by Data Prepper and stored in SmartObserve.
Download or clone the Data Prepper repository. Then navigate to examples/log-ingestion/ and open docker-compose.yml in a text editor. This file contains a container for:
- Fluent Bit (
fluent-bit) - Data Prepper (
data-prepper) - A single-node SmartObserve cluster (
smartobserve) - SmartObserve Dashboards (
smartobserve-dashboards).
Close the file and run docker compose up --build to start the containers.
After the containers start, your ingestion pipeline is set up and ready to ingest log data. The fluent-bit container is configured to read log data from test.log. Run the following command to generate log data to send to the log ingestion pipeline.
echo '63.173.168.120 - - [04/Nov/2021:15:07:25 -0500] "GET /search/tag/list HTTP/1.0" 200 5003' >> test.log
Fluent-Bit will collect the log data and send it to Data Prepper:
[2021/12/02 15:35:41] [ info] [output:http:http.0] data-prepper:2021, HTTP status=200
200 OK
Data Prepper will process the log and index it:
2021-12-02T15:35:44,499 [log-pipeline-processor-worker-1-thread-1] INFO com.amazon.dataprepper.pipeline.ProcessWorker - log-pipeline Worker: Processing 1 records from buffer
This should result in a single document being written to the SmartObserve cluster in the apache-logs index as defined in the log_pipeline.yaml file.
Run the following command to see one of the raw documents in the SmartObserve cluster:
curl -X GET -u 'admin:<custom-admin-password>' -k 'https://localhost:9200/apache_logs/_search?pretty&size=1'
The response should show the parsed log data:
    "hits" : [
      {
        "_index" : "apache_logs",
        "_type" : "_doc",
        "_id" : "yGrJe30BgI2EWNKtDZ1g",
        "_score" : 1.0,
        "_source" : {
          "date" : 1.638459307042312E9,
          "log" : "63.173.168.120 - - [04/Nov/2021:15:07:25 -0500] \"GET /search/tag/list HTTP/1.0\" 200 5003",
          "request" : "/search/tag/list",
          "auth" : "-",
          "ident" : "-",
          "response" : "200",
          "bytes" : "5003",
          "clientip" : "63.173.168.120",
          "verb" : "GET",
          "httpversion" : "1.0",
          "timestamp" : "04/Nov/2021:15:07:25 -0500"
        }
      }
    ]
The same data can be viewed in SmartObserve Dashboards by visiting the Discover page and searching the apache_logs index. Remember, you must create the index in SmartObserve Dashboards if this is your first time searching for the index.